
Stop guessing which towns are worth the ad money.
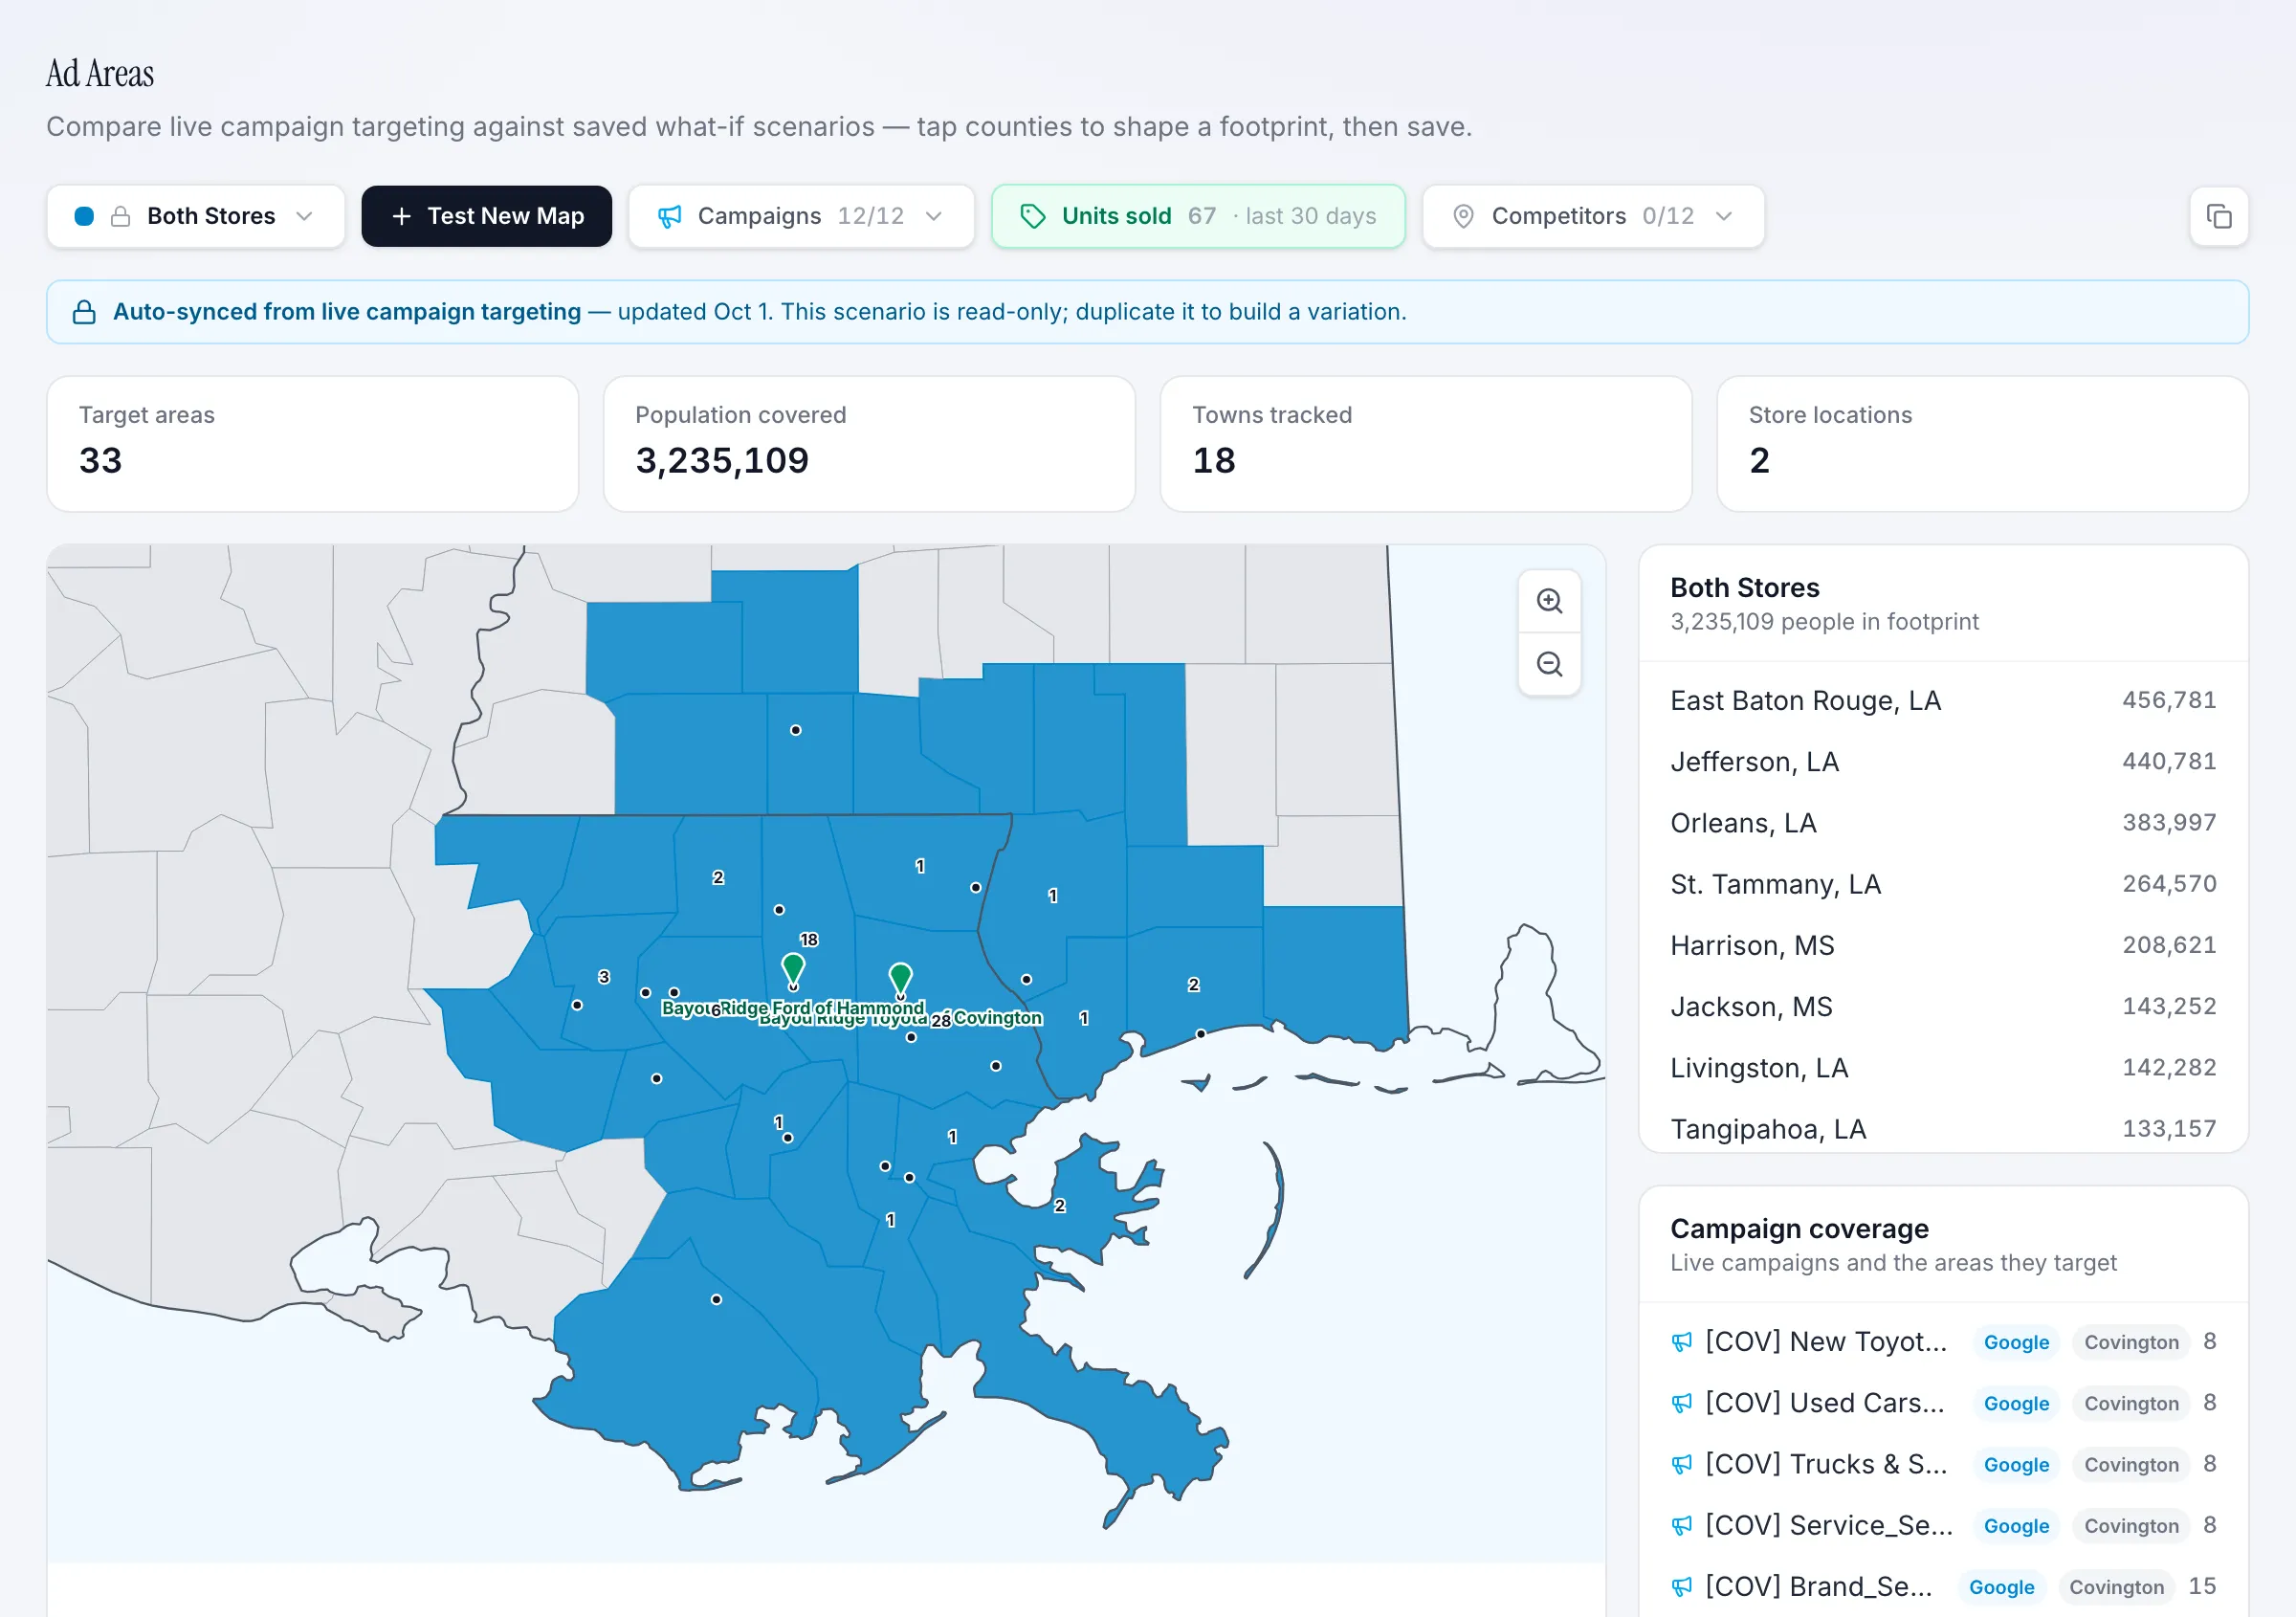
Ad Areas puts your live campaign targeting, cost per lead by area, and units sold by customer home county or parish on one map. When a parish 40 miles out sells as many cars as the one next door at twice the CPL, you see it — and you can test a new footprint before spending a dollar on it.
Quick sign-up, then click anything. It's a fictional dealer group with example numbers.
Your agency reports a radius. Your buyers live in counties and parishes.
Most dealer ad reports stop at "the campaign targets 30 miles around the store." Nobody connects where the ads ran to where the cars were sold — so the budget never moves.
Primary markets get starved because a cheap secondary area pads the lead count. Distant towns that quietly buy trucks every month get cut because nobody looked at the deal jackets.
One map for spend, leads, and sold units.
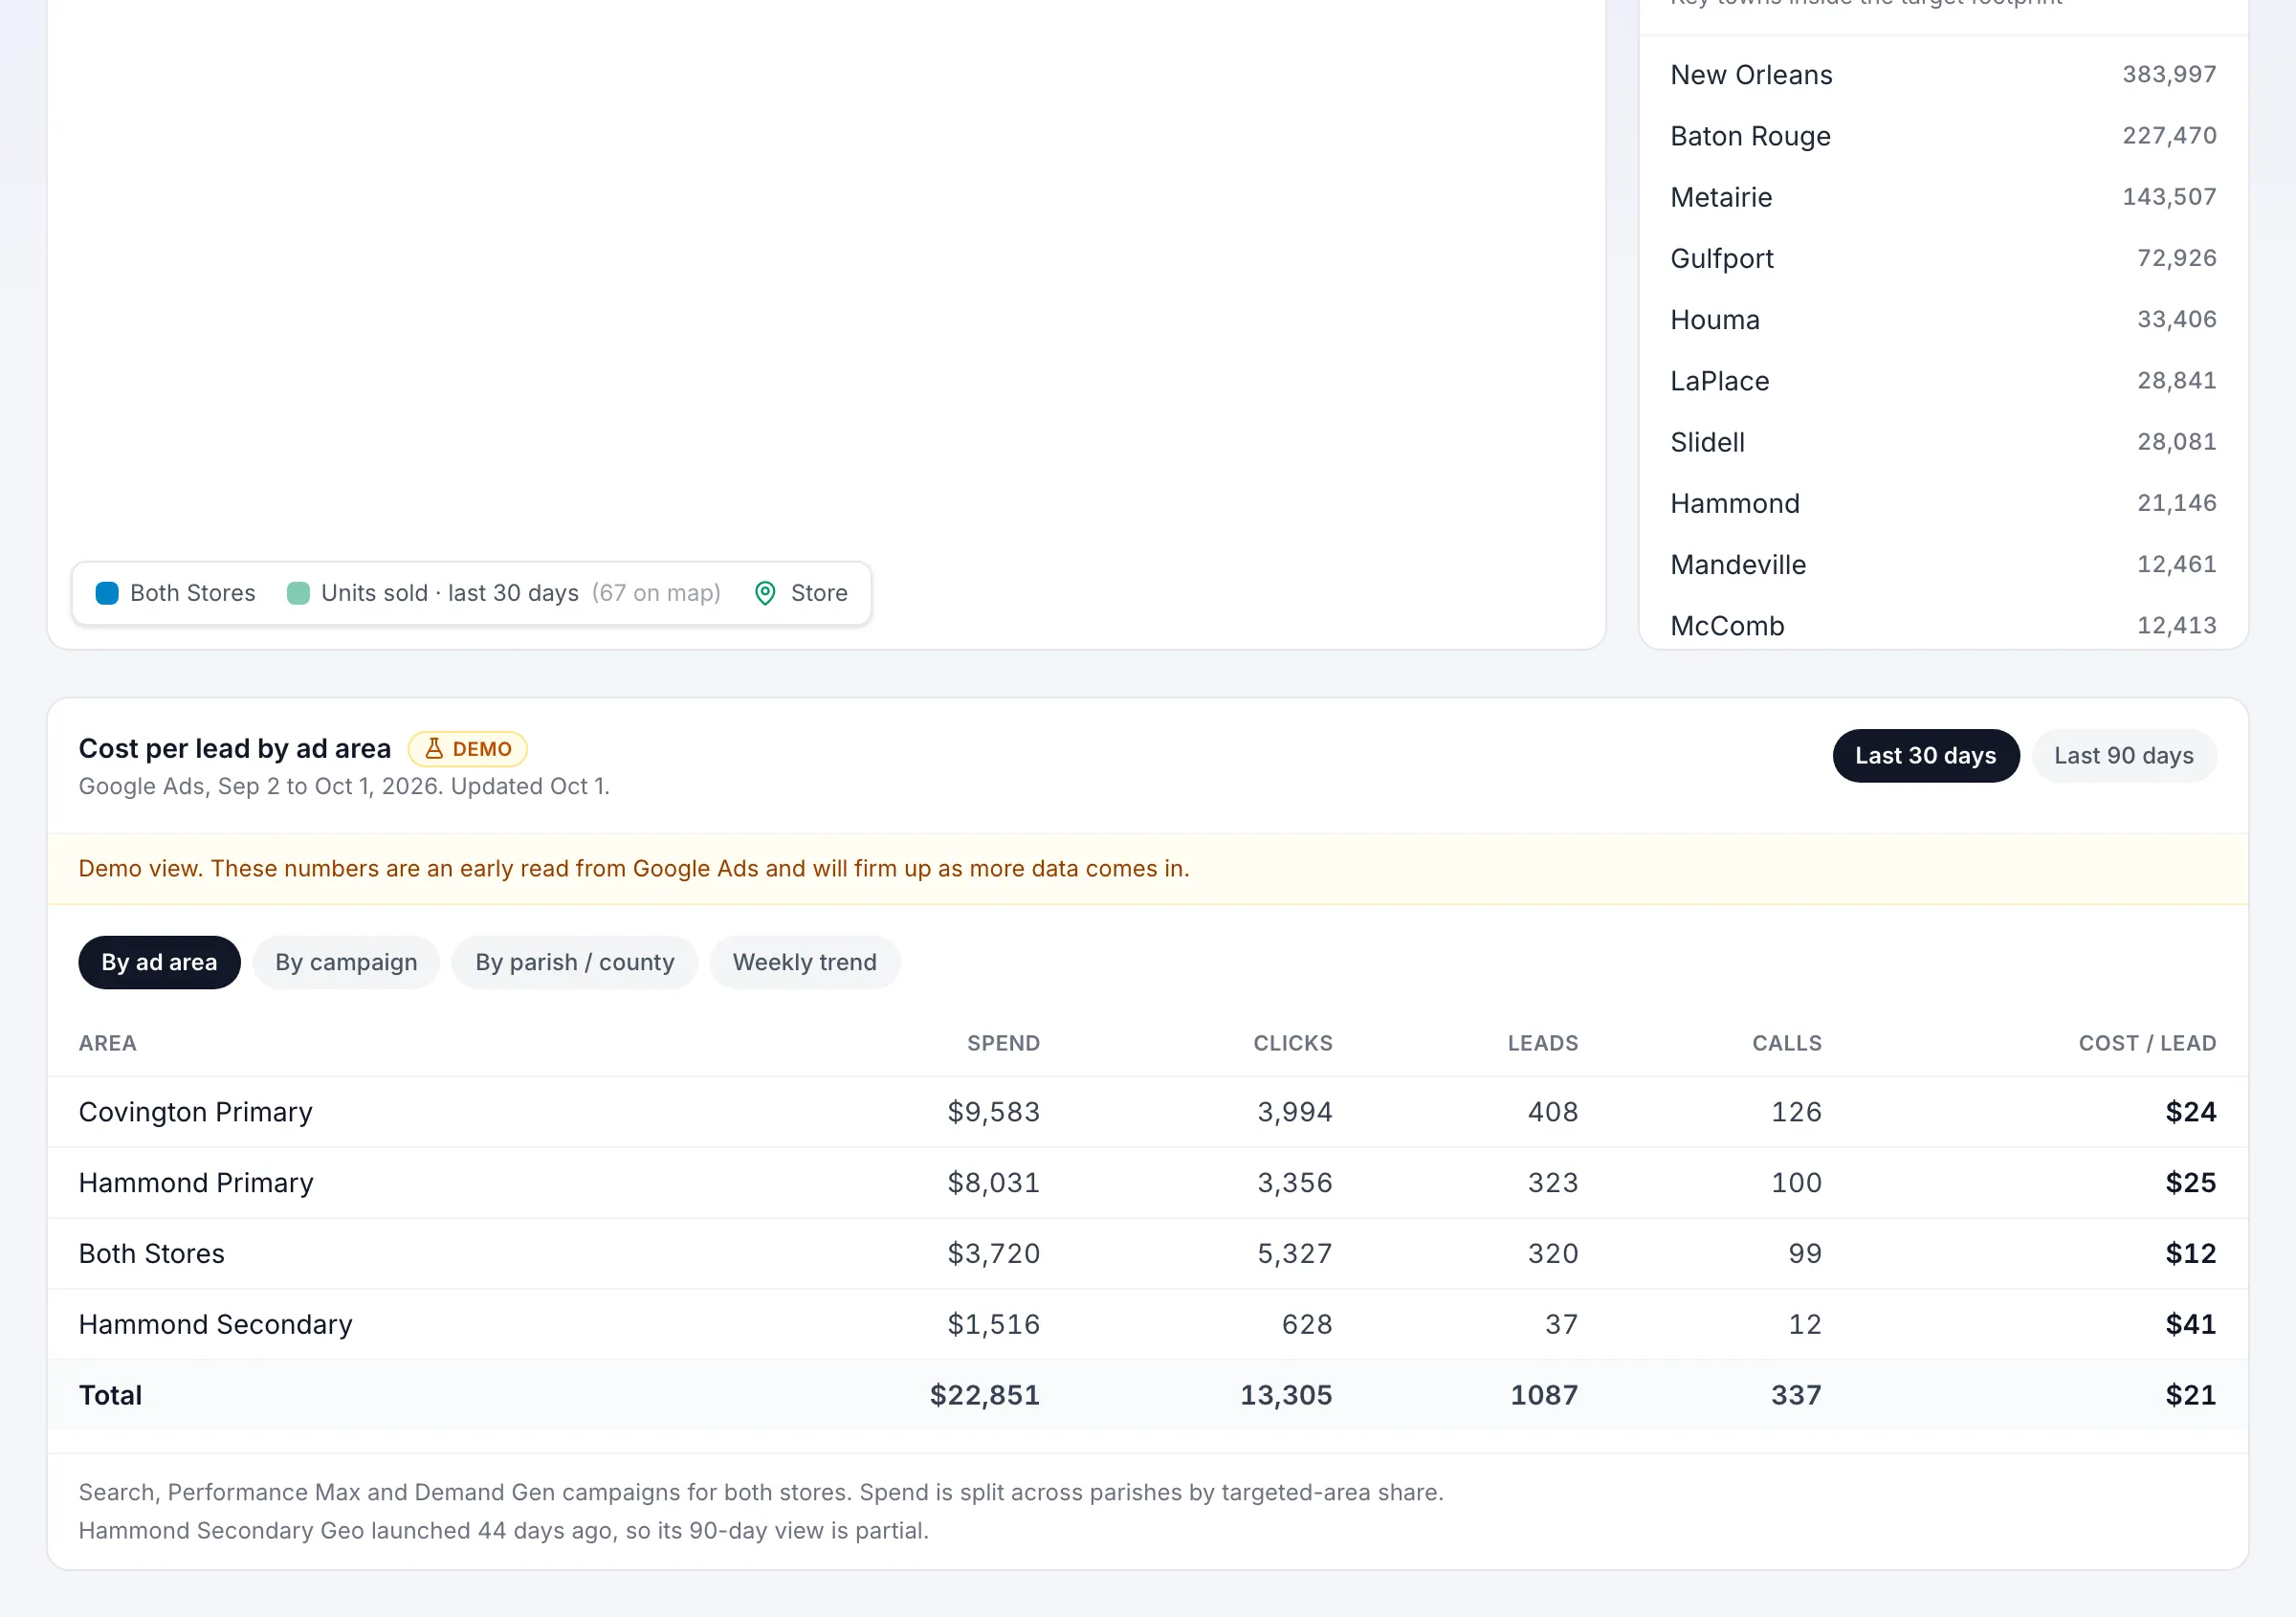
Cost per lead by ad area
Spend, clicks, leads, calls, and CPL for every area — primary vs. secondary for each store — with 30- and 90-day views and a weekly trend.
Units sold by customer county or parish
Sold units from your CRM, placed by the buyer’s home address and overlaid on the targeting map. Your real trade area, not the one in the campaign settings.
County and parish drill-down
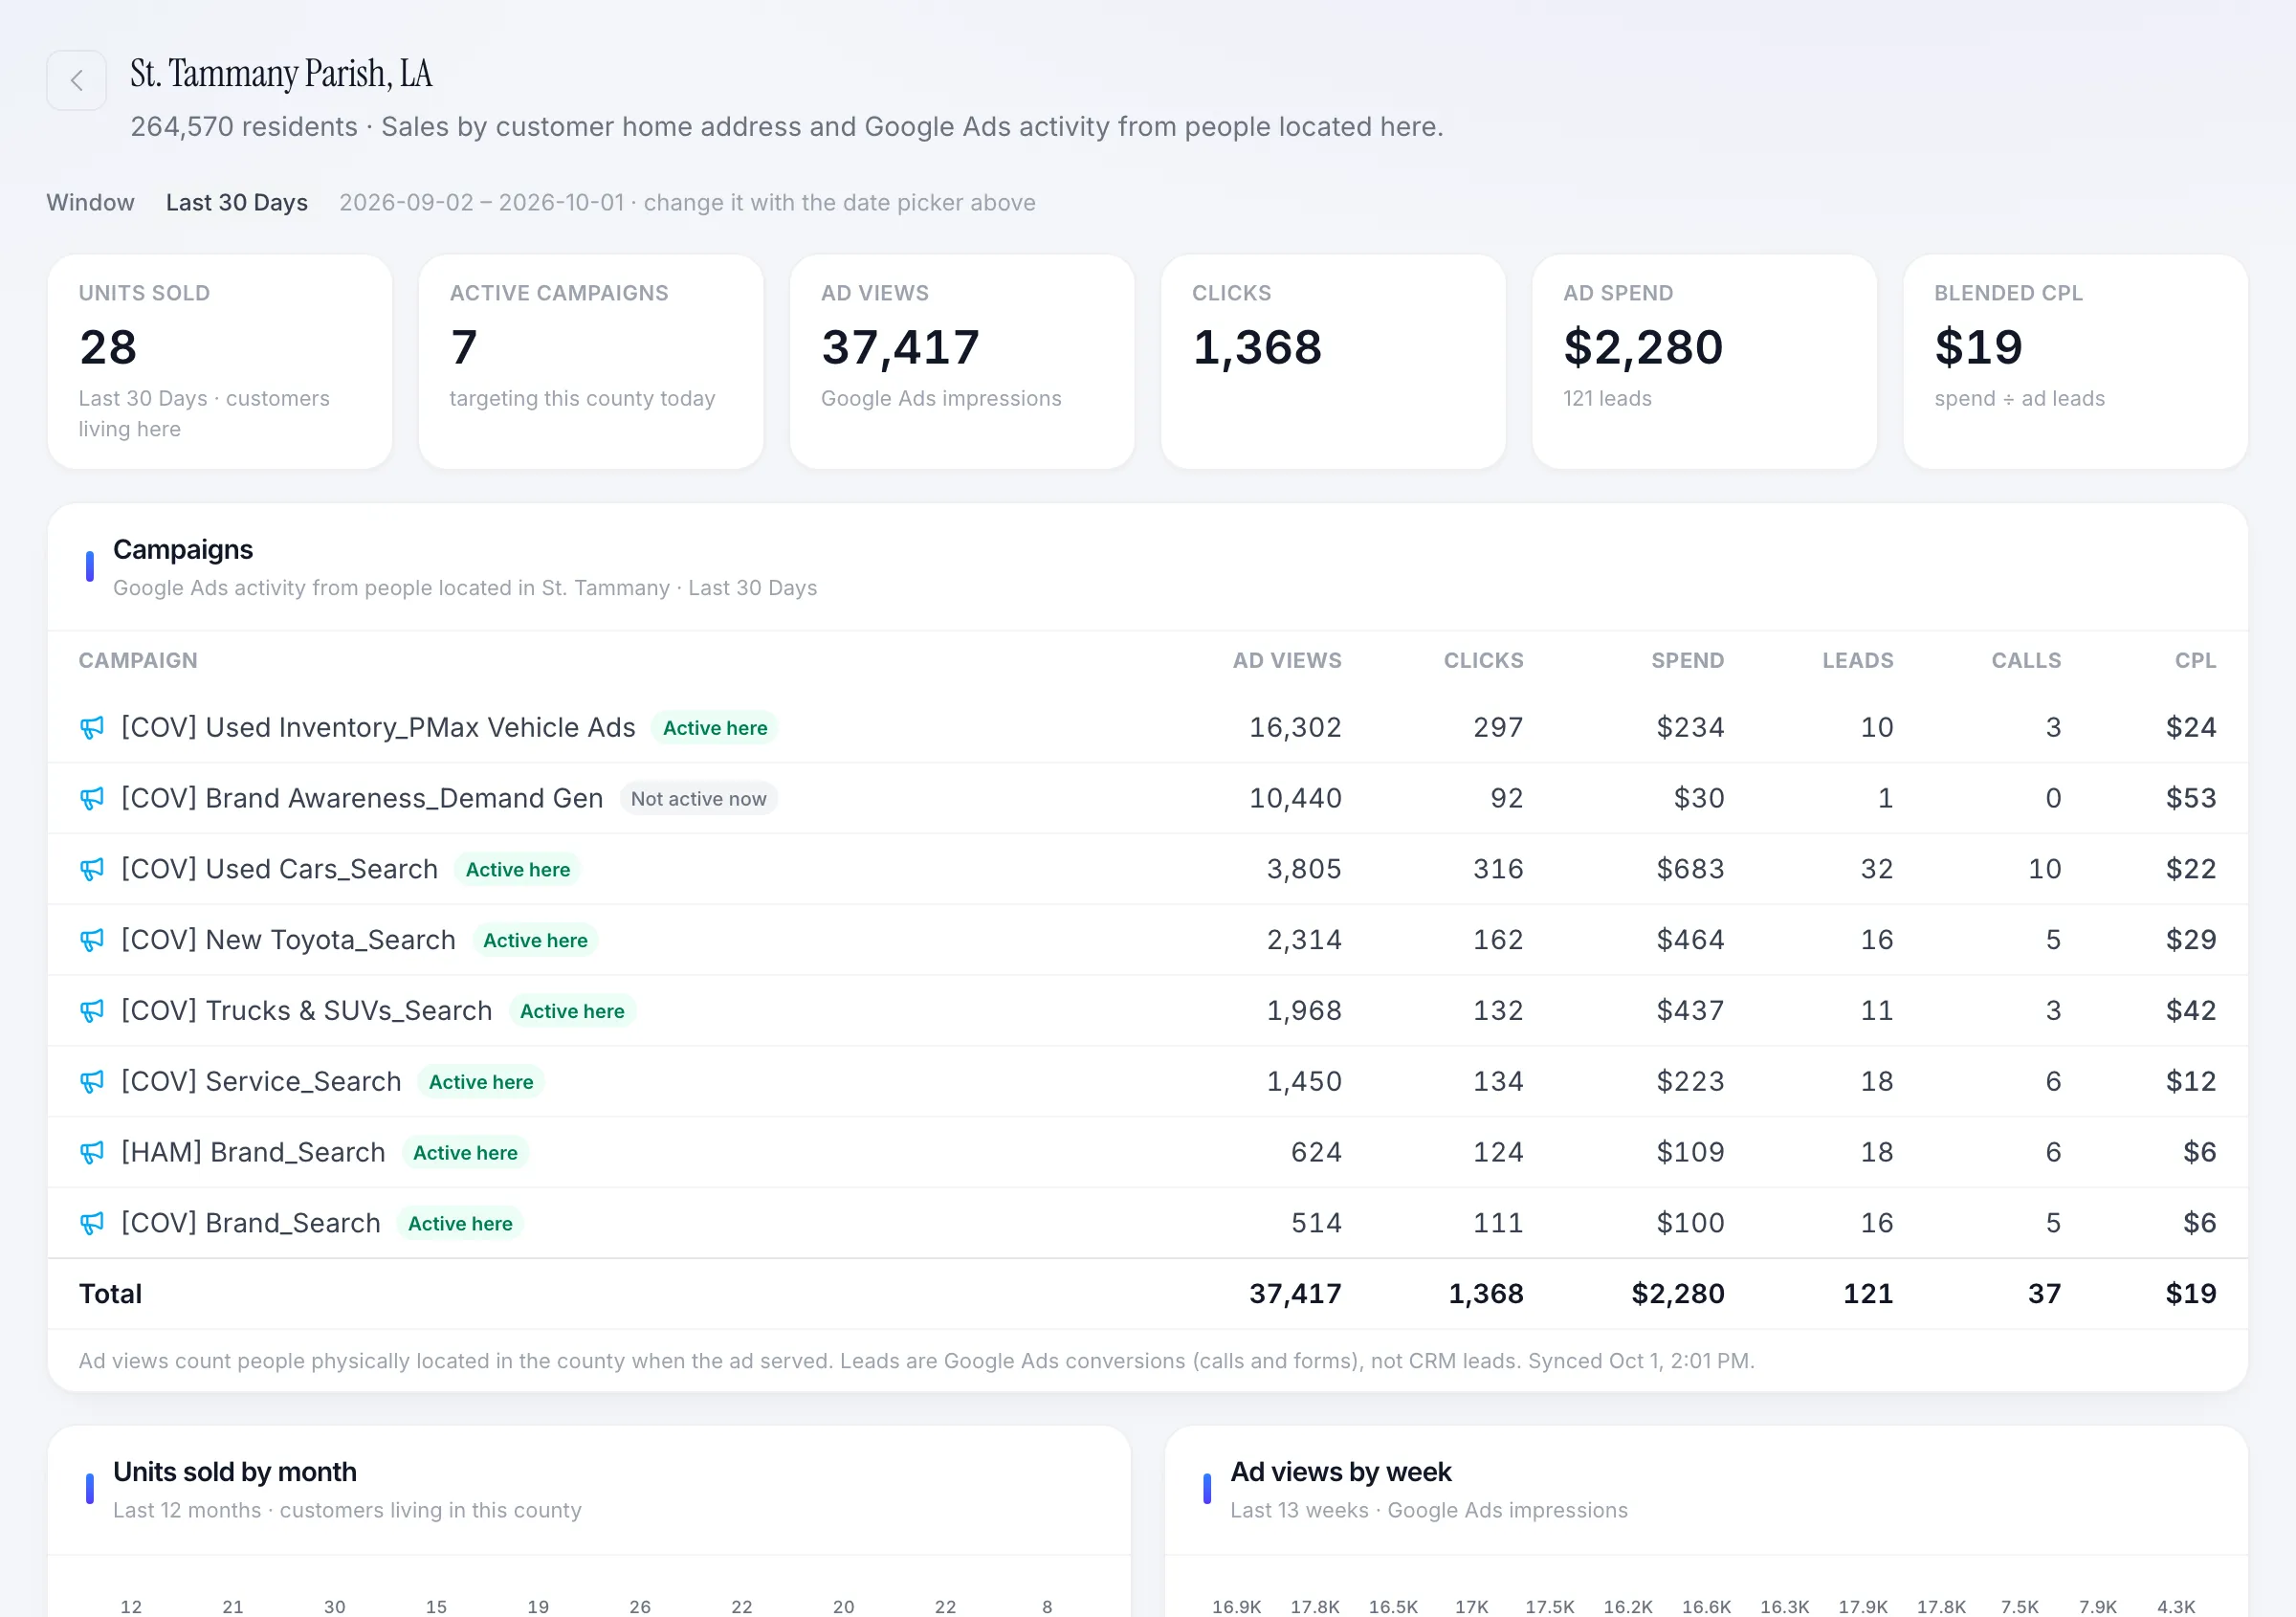
Tap any county or parish: units sold, active campaigns, ad views, clicks, spend, and blended CPL for people physically located there — plus 12 months of sales history.
Live targeting, auto-synced
The map reads targeting straight from your live campaigns every day, so what you see is what is actually running.
What-if footprints
Duplicate the live map, add or drop counties or parishes, and see population covered before you change a single campaign.
Per-store or combined
Flip between rooftops or view the whole group. Overlapping markets between stores become obvious.
See it with real-looking numbers.
Don't take the screenshots' word for it.
Bayou Ridge Auto Group is a fictional two-store Toyota and Ford group running on the same portal our dealer clients use. The numbers refresh every morning. Change the date range, switch stores, open any lead.
What dealers ask us.
- Where does the sales data come from?
- Your CRM. We sync sold units and the buyer’s address (we run this on eLeads today and connect others on request), then geocode to county or parish. Nobody keys anything in.
- Is "leads" here the same as CRM leads?
- Ad Areas uses Google Ads conversions (calls and forms) so it can be split by location. CRM leads and close rate live on the Leads and Sales page. We label both so they’re never confused.
- Does it work with Meta ads?
- Meta only reports location at the DMA level, so Meta spend shows at the market level. Google Ads gets full county and parish detail.
Everything else a dealer gets.
- Leads and SalesEvery lead from every source — website, OEM, third-party sites, chat, phone-ups, walk-ins — pulled from your CRM with sold units and closing rate per source.See how it works
- Sales TeamPer-salesperson leads, close rate, units, follow-up gaps, and outbound calls — ranked, so you know who to give the next lead to.See how it works
- AI Chat & DemandAn AI sales assistant that quotes real units from your feed, captures after-hours leads into the CRM, and shows which vehicles shoppers want that you don’t have.See how it works
- Inventory IntelligenceAging buckets, model cohorts, and live competitor price matching for every unit — so you know what’s overpriced before it turns 90 days old.See how it works
- Ad Spend & Co-opReal conversions per campaign, budget pacing across every agency you use, and OEM co-op funds tracked through to reimbursement.See how it works
Ready to put a marketing + technology team behind your business?
20-minute intro call. We'll tell you what we'd build first.